Cintra iQ allows you to create and manage your own reports from within the Cintra iQ system. Once created, the reports are then available at the bottom right of Cintra iQ and can be used whenever required.
A payroll report produces a single row of data per employee per pay period, and its filter applies to data only. For the other report type, see Creating and running listing reports.
Go to Cintra iQ:
Lower right-hand corner > Reports > Reports window
Menu bar > Definitions > Reporting > Reports > Reports window
Payroll report: definition and example
Payroll reports let you report cash values on one or more pay periods. When you run a Payroll report, you can choose to only view data from specific payroll(s) and period(s).
For example: if I wanted to see a report on the net pay of every employee within the company, I would create a Payroll report definition to show all periods of net pay belonging to that employment record.
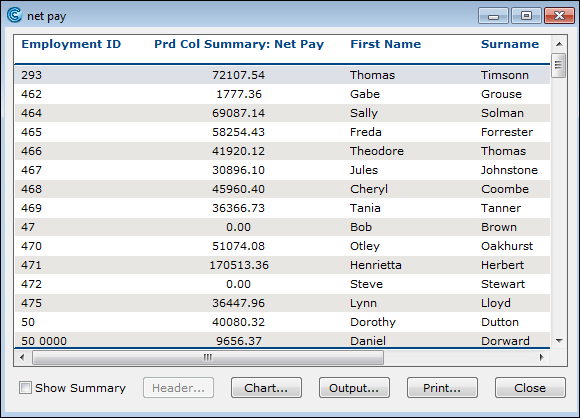
When creating the Payroll report definition, you can:
Identify the payslip data on which to base the report. For more information, see the Payroll Listing tab.
Format individual columns (optional). For more information, see the Field Details tab.
Sort columns (optional).
Format printing options (optional).
Filter by data.
For the steps to assign data to the report, see Assigning data to the listing or payroll report.
Generating/running a payroll report
Navigate to the Reports window.
Highlight a Payroll report.
Click the Run button. The Payroll Report window appears showing a list of your company's payrolls
Select one or more payrolls and a reporting period.
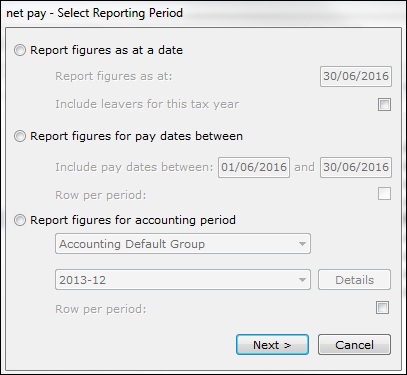
Report figures as at a date: Select this option to enter the relevant payroll pay period in which the date falls. It displays the current period values in the pay period.
Report figures for pay dates between: By default, the period values are summed and year to date values display as at the last period in the range.
Report figures for accounting periods: It works in the same way as Report figures for pay dates between except that Cintra iQ uses the payroll periods in the accounting period instead of the periods falling between the two selected dates.
Click Next. Now you must confirm which payroll(s) you are reporting on, then
Click Next. You can now select whether to report on all employees in the payroll, or on specific / multiple employees.
Click Run to create the report.